Abstract
As malware analyst one of the most tricky executable to analyze that I faced are the P-code visual basic executables. That is why I am writing this post, to help all new analysts who need some tips to unmask this kind of tricky malicious executable :).
In order to illustrate the explanation I will use a malware sample known as NgrBot which comes “packed” in a Visual Basic executable.
It can be downloaded from VirusTotal –> MD5: 2749db2586ed61451442e19615674010
The analysis will be divided in three post where will describe step by step how I have performed the reverse engineering process, explaining little analysis tricks and curiosities about this particular simple.
Identify file
The first thing that we need to know when we pretend to analysis an unclassified software is which kind of sample we have in our hands. Personally I like to use a tool named exeinfope which provides really useful information about the file and other functionalities that we will use later.
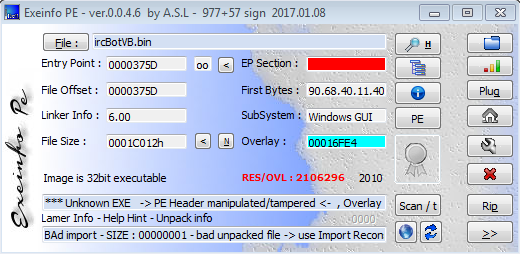
Looks like that we are dealing with something serious here. And for now we can not say it is a visual basic executable. Lets take a look to it with our favorite debugger in my case I will use “OllyDbg”.

This are the first 4 instructions of the program, we can see that it is calling to the function number 100 (ThunRTMain) of dll “Msvbvm60” which is known as “Microsoft Visual Basic Virtual Machine COM layer msvbvm60”. Now we can say that it is definitely a visual basic executable.
Note: Before we get into the details, it is necessary to understand that we are dealing with a virtual machine interpreter. That means that we will no be able to see the code that it is going to be executed (the source code I mean) but at least we can see all the API call that the program is doing. Which will provide us enough information to have an idea of what is going on.
Seeking API Calls
So our next step is to identify the API calls. It could be really tedious if you do not how the library works because there is a lot of junk code in the execution. What I like to do is to set a break point in the function named DllFunctionCall which will be call every time an API call is performed.

Note: In order to find it easily just introduce in the command box –> “bp DllFunctionCall” and press F9 to let the program run until it hits the breakpoint.
Once we reach the break point we will be placed inside DllFunctionCall which will return the address of the API call that the program wants to execute in this case the first call made is vbaCopyBytes. Lets keep seeking ;)
vbaCopyBytes

Usually the return point it is a “jmp eax” but we will see that it uses another methods.

Now lets take a look of what it is coping. The first instruction are made to prepare the copy loop which will copy the first 10 Dword store in the address 009054AD.

If we follow in the dump the register “edi” we can see that it has been copied the header of a executable Interesting :). Maybe we are lucky and all the executable is in the address saved in “esi”.

Oh yeah there it is :)

Note: if you place a break point some were inside this function you will notice that it is recalled multiple time in order to copy the full executable to the new location. But as we only care about the address of the begging and the full executable saved in the source, we can ignore it.
Dumping suspicious MZ
Once we have found a MZ in memory there is just one thing to do –> Dump and reconstruct it. There are multiple ways to dump it, you can use the OllyDbg plugin “OllyDump” but I personally prefer, in this case, just to do it manually. Selecting all the code from the beginning of the MZ to the end and saving it whit Right Click + Backup + Save data to file.

The most probable thing is that we had dump our MZ + extra unwanted junk. First it is probably that the file contains some extra junk at the beginning, just open it with your favorite hex editor (010 editor) and remove it manually and save the file.

Additionally to remove the junk tail I like to use again “exeinfope”. Opening the dumped binary and use the option Overlay Menu + trunk overlay (generate new file) and voila we have our MZ ready to be opened in IDA or any other dissembler to be analyzed.

for the time being we will keep following the execution pressing “F9” to go to the next call in DllFunctionCall and later on we will return to examine this file which probably will be executed in some point.
###GetModuleFileNameW
The next function called is GetFileNameW which retrieves the fully qualified path for the file that contains the specified module.
Note: The module must have been loaded by the current process.
In this case after the return we were placed in the middle of the Dll jungle but do not panic. Lets use a little trick to jump directly to the important code placing a break point in GetModuleFileNameW address (76B34950) + F9
The parameters that the function receives are:
hModule: A handle to the loaded module whose path is being requested.
lpFilename/PathBuffer: A pointer to a buffer that receives the fully qualified path of the module.
BufferSize/nSize: The size of the lpFilename buffer, in TCHARs

In our case the pointer is save in “00604C6C” that will contain his own file path.
CreateProcessW
Now it is going to create a son process. We can proceed as before to reach the “CreatePorcessW” call. Which will create a sub-process with the following characteristics:


Note: notice that it is going to be initialized suspended which makes me suspect that it will be has something to do with the MZ loaded before.
In the father process it is saved his son’s the handler (0xC8) which will be used later, keep it in mind.

ZwUnmapViewOfSection
The ZwUnmapViewOfSection routine unmaps a view of a section from the virtual address space of a subject process.
Input parameters:

VirtualAllocEX
VirtualAllocEX reserves, commits, or changes the state of a region of memory within the virtual address space of a specified process. The function initializes the memory it allocates to zero.

ZwWriteVirtualMemory
Now it will write into the son’s process the MZ that we extracted previously which is allocated in “397AA0”. As before “ZwWriteVirtualMemory” is going to be called multiple time in order to copy all the executable code to his son.

ZwGetContextThreat
It retrieves the context of the specified thread. Which will be modified in the next call.

ZwSetContextThreat
Sets the context for the specified thread.

ZwResumeThreat
This one is going to be the last operation done by the father’s hand and the code injected in his sons which is the real malicious code is going to be executed.
The only parameter that it receives is the son’s thread handler “0xC”.
Now is when the muddy staff beggings :).
Conclusion
Up to now, we have seen that the original Visual Basic executable just has injected a MZ executable inside a new process. And as we will see it is a dropper/deployer that will make the infection persistent in the system.
Tools
- OllyDbg
- ProcessHacker
- ExeInfo
- 010 hex editor